What's in every subscription
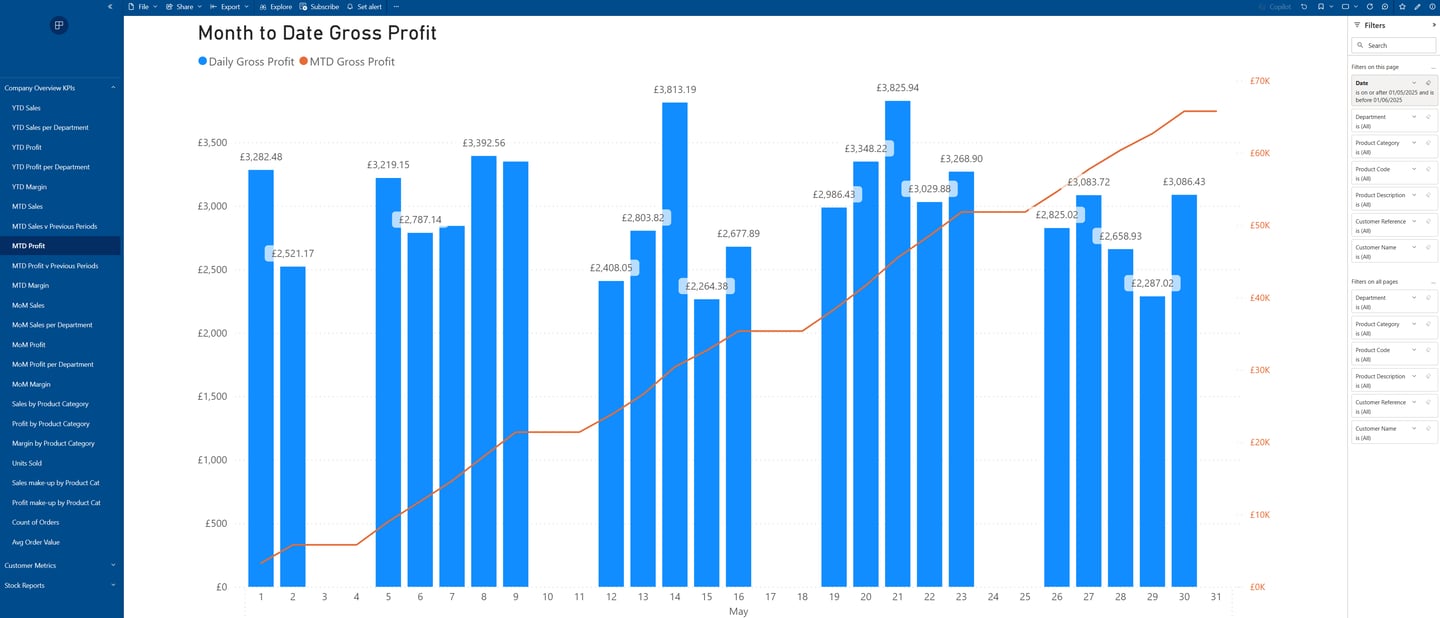
Company Overview KPIs
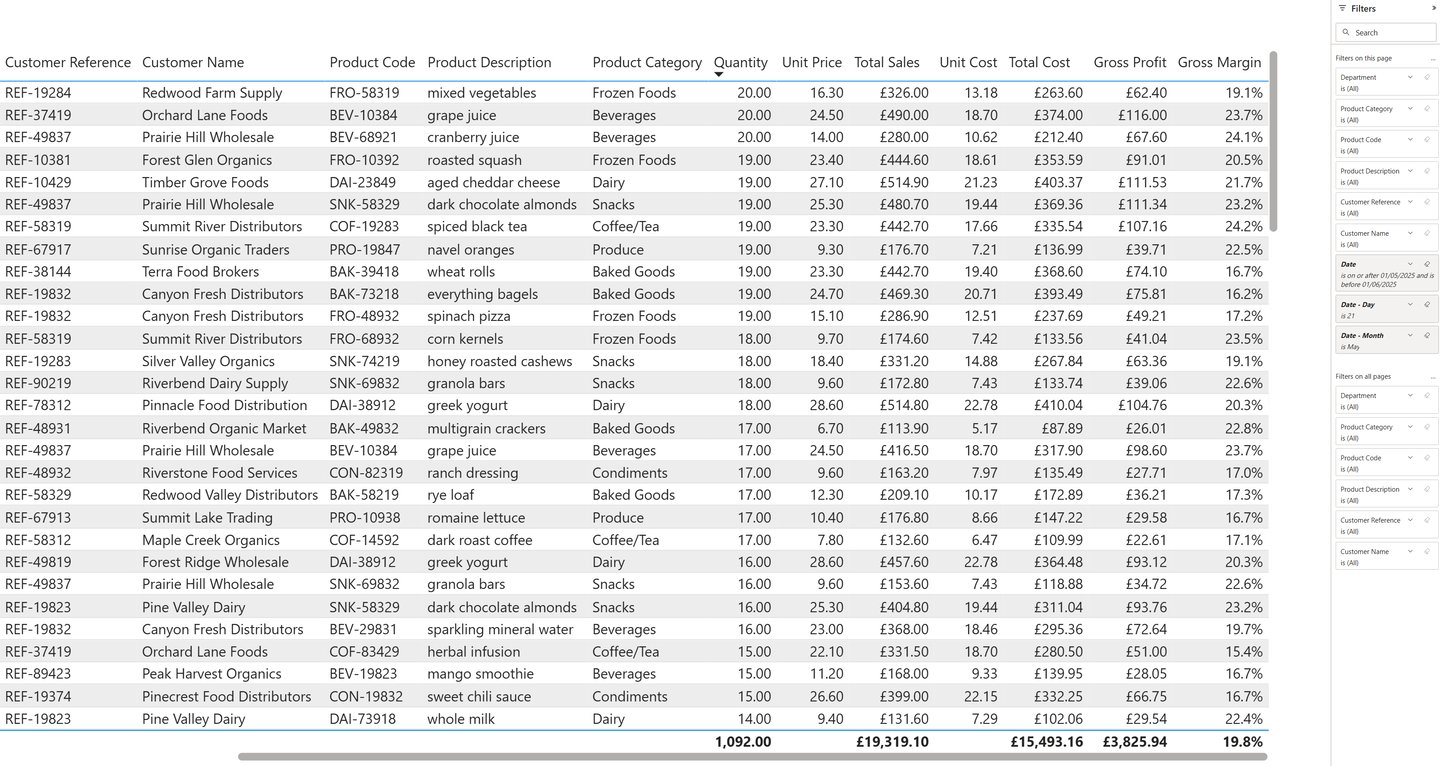
Monitor your business performance across year-to-date, month-to-date, and month-on-month periods with comprehensive visibility into sales, profit, and margins. Every metric breaks down by department and product category, giving you granular control over what you're analysing.
Track operational metrics like units sold, order count, and average order value to understand not just revenue, but customer behaviour and product performance. Drill down from any top-level number to see the detail behind it – whether you're investigating a spike in sales or tracking margin changes over time.
With extensive filters always available, you can analyse any metric at any point in time, slice data by multiple dimensions simultaneously, and get exactly the view you need for any decision – from quick daily checks to deep strategic analysis.
Break down any top-level number from within the charts or reports into its underlying details, and filter to further zero in on what matters.
An overview of the modules for your Sage 50 intelligence reporting
Customer Metrcis
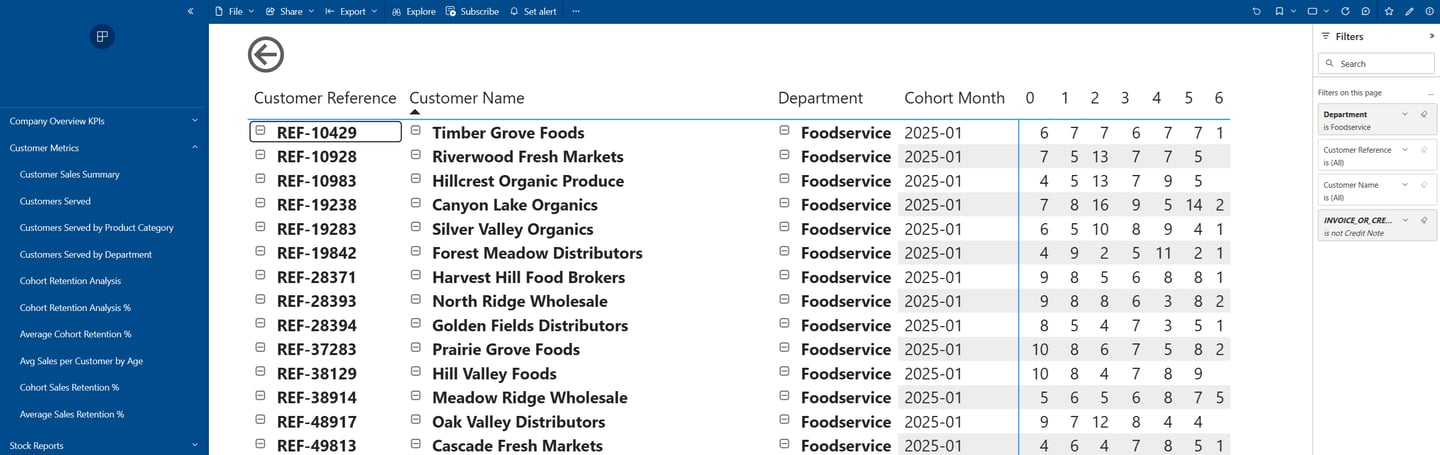
Cohort retention analysis groups customers by when they first purchased from you, then tracks how many return to buy again in subsequent months. Instead of just seeing total customer counts, you see whether customers acquired in January are more loyal than those from March, or whether your retention is improving over time.
This reveals patterns that traditional reports miss: are you building a loyal customer base or constantly replacing churners? How long does it take for a typical customer to make their second purchase? Which marketing campaigns or product changes actually improved loyalty?
The module also breaks down customer performance by product category and department, shows average sales per customer as they age, and calculates retention percentages across different timeframes. You'll understand not just how many customers you're serving, but whether you're building sustainable, repeating revenue or running on a treadmill of one-time buyers.

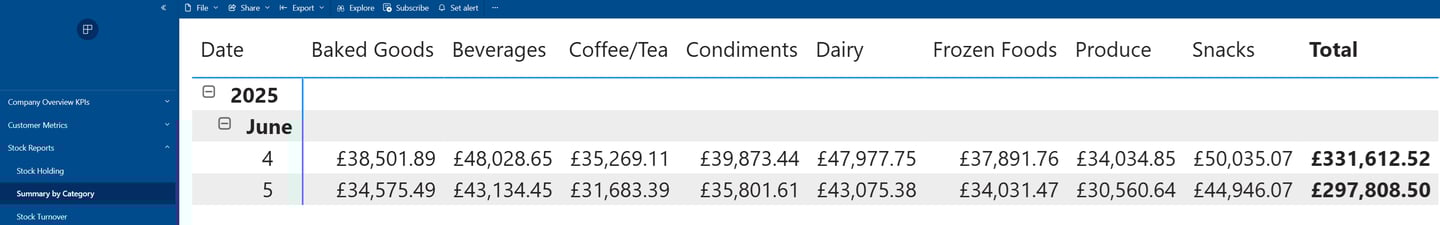
Stock Reports
Track your inventory value and quantities over time with daily snapshots that build a complete picture of your stock movements. See current holdings broken down by product category, then look back to understand seasonal patterns, identify slow-moving stock, and spot trends before they become problems.
The stock turnover analysis shows how quickly you're rotating inventory – whether products are flying off the shelves or gathering dust. Filter down to specific categories or individual products to see exactly where capital is tied up and which lines are performing.
Important: These reports build over time. Each day adds a new snapshot to your historical data, so the longer you're subscribed, the more valuable the trend analysis becomes. You'll see meaningful patterns after a few weeks and comprehensive historical comparisons after several months.
More than we can show here
These modules represent the foundation of your business intelligence, but the platform's capabilities go much deeper. Every metric can be filtered, compared, and analysed from multiple angles – there are far too many possible breakdowns and views to demonstrate on a single page.
Some of these screenshots may look dense at first, but they'll make perfect sense once you're working with your own familiar business data. When you subscribe, we'll provide guidance on getting the most from your reports – from setting up your preferred views to understanding the more advanced analytics.