What is Cohort Analysis – and how to get it from your Sage 50 data
If you've ever wondered why some months feel busier than others, why certain customers keep coming back while others disappear after their first purchase, or whether that promotion you ran in March actually worked – cohort analysis is the tool that answers those questions properly. If you're running Sage 50, you have all the data you need for this – you just need the right way to look at it.
Let's break it down.

What is a cohort?
A cohort is simply a group of people who share something in common during a specific time period.
In a business context, the most common cohort is customers grouped by when they first bought from you. Everyone who made their first purchase in January is one cohort. Everyone who first bought in February is another.
What is cohort analysis?
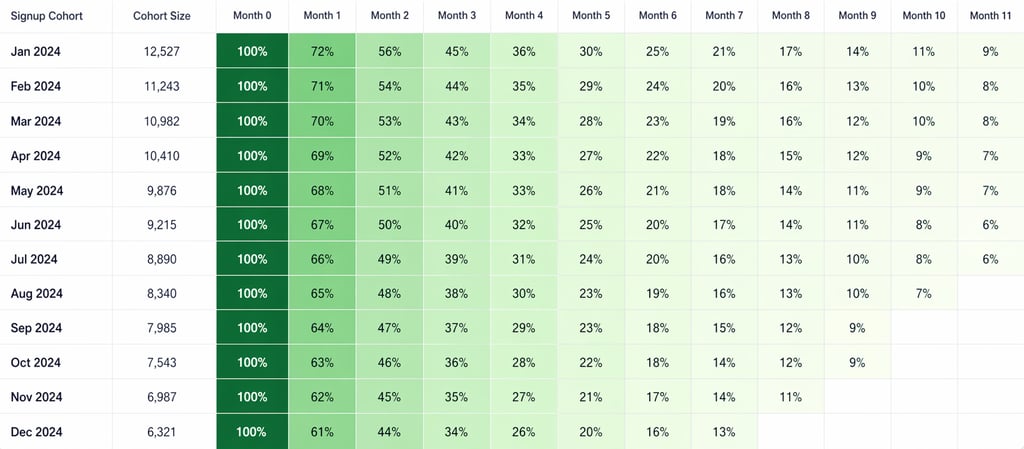
Cohort analysis is the process of tracking what those groups do over time and comparing them to each other.
Instead of looking at your total sales figures month by month (which tells you what happened), cohort analysis tells you who is driving those numbers and whether your business is getting better or worse at retaining customers.
Here's a Sage 50 example:
Imagine you pulled your data and saw 50 new customers in January and 50 new customers in March. By June, 30 of your January customers have bought again, but only 10 of your March customers have. Your overall sales might look fine, but something changed between January and March. Maybe a product quality issue, a change in how you're acquiring customers, or a seasonal pattern.
Without cohort analysis, you'd never spot it.
Why does this matter for your business?
1. It reveals your true retention picture
Total revenue can hide a retention problem. If you're constantly winning new customers but losing existing ones at the same rate, your business is essentially running on a treadmill. Cohort analysis shows you whether customers are actually sticking around, and for how long.
2. It helps you measure the real impact of changes
Did that new product line work? Did the price increase hurt loyalty? When you compare cohorts from before and after a change, you get an honest answer, not just a gut feeling.
3. It shows you where your best customers come from
Some cohorts are simply more valuable than others. Cohort analysis lets you identify which time periods, promotions, or sales channels produced customers who spend more and return more often. Then you can do more of what works.
4. It helps with forecasting
Once you understand how cohorts typically behave over 3, 6, or 12 months, you can forecast future revenue with much greater confidence than looking at last month's numbers alone.
See it in action
If you're using Sage 50, you don't need to export data or build spreadsheets. Delphion Data pulls your Sage 50 data automatically and delivers cohort analysis and customer reports alongside stock, sales, and financial reporting – 35+ reports built specifically for Sage 50 users.